post officially posted on Medium on March 21, 2025 (rest in peace, Medium)
Time-series forecasting isn’t magic. It’s pattern hunting with math, data, and a bit of skepticism. Whether you’re predicting sales, server loads, or stock prices, the goal is simple: make tomorrow less surprising. In this post, I’ll walk you through how different forecasting models do exactly that: make tomorrow less surprising.
Lately, I’ve been playing fortune teller (except for the crystal ball) using AWS SageMaker Canvas to explore retail prediction models. Instead of vague prophecies, it leans on six different algorithms to crunch numbers and spot trends in time-series data:
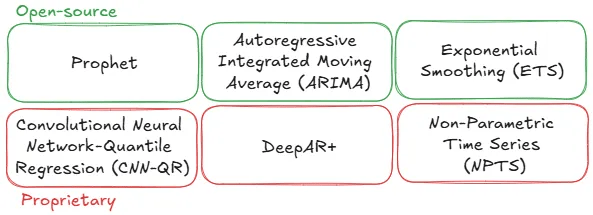
In this post, let’s talk about the open-source models that SageMaker Canvas uses: Prophet, ARIMA and ETS. Thing is: most forecasts are useless. Some are dangerously wrong. But a few are good enough to bet on. The difference isn’t luck — it’s knowing how to compare them before they fail you.
Which model works best?
Imagine you are the owner of an ice cream shop and you record historical data on ice cream sales over time.

You have great employees who have been working in your business for many years, but they don’t have technical knowledge in data models. Which model applies to your case? Let’s see.
Prophet
Prophet (2017) is a forecasting procedure implemented in R and Python, which was released by Facebook (Sean J. Taylor and Benjamin Letham) on an open-source format. You can check out the full paper here.
It was built based on two main assumptions:
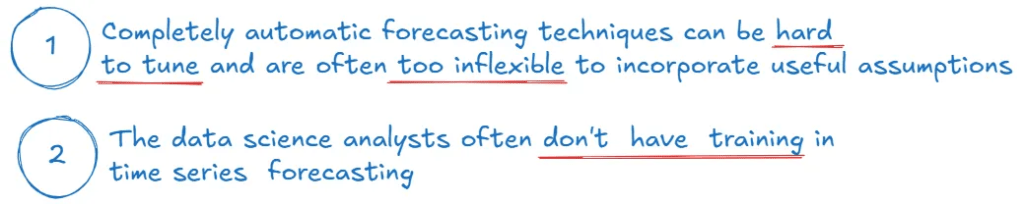
Basically, the model is a regression with parameters that can be intuitively adjusted by analysts without knowing the details of the underlying model. It was built for a wide range of time series, yet configurable by non-experts who may have domain knowledge about the data generating process but little knowledge about time series models and methods. It needs human evaluation!

In the case of your ice cream shop, most of the staff will be busy making the delicious treats or running the sales operation. Since you don’t have a dedicated analyst to dive into the details of complex forecasting models, but you do have someone who really knows the business, Prophet might just be a good option for you to test. The model works with four model components, combined by the following equation:

As you can see, Prophet faces the forecasting problem as a curve-fitting exercise, which which is different from time series models that explicitly account for the temporal dependence structure in the data. Ok, but how can your employees input their business knowledge on the equation?

Alright… but can I see the results? Yes! The authors tested Prophet on a Facebook events prediction challenge, showing how it connects past trends (solid line) and forecasts future activity (dashed line):
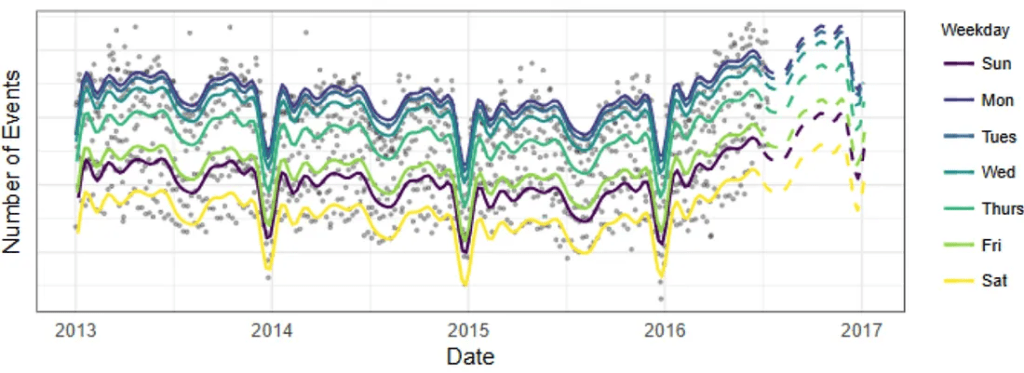
The solid line represents how well Prophet fits the historical data — it’s like retracing a path you’ve already walked to make sure you got it right. The dashed line, on the other hand, is Prophet’s best guess for the future based on those patterns. If both lines stick closely to the actual data points, it means the model is doing a great job at understanding past trends and making reasonable predictions.
As you can see, Prophet is a flexible model that intents to blend the advantages of statistical forecasting (based on data) and judgemental forecasting (based on specialists knowledge). The result relies on proper evaluation of forecast quality and good visualization tools.
ARIMA (Autoregressive Integrated Moving Average)
Autoregressive modeling and moving average modeling are two different approaches for forecasting time series data. ARIMA is a group of models that combines these two approaches: it’s like the Batman and Robin of forecasting — separately they’re solid, but together they’re a game changer!
ARIMA works better with stationary data. A time series can be either stationary or non-stationary.

A stationary time series has statistical properties that stay the same over time. This means that stats like the mean, variance, and autocorrelation don’t change as you go along.
You can work with non-stationary data, but it’s like trying to predict the weather with a crystal ball — good luck with that, ARIMA!
Unlike Prophet, ARIMA is not a curve-fitting equation. It assumes the statistical properties will be roughly the same in the future. The model works with three key parameters:

You need to analyze your time series to determine which ARIMA model best fits your case. Here are some examples of classic ARIMA models:

According to the Prophet creators, ARIMA models require modeling expertise that many forecasting beginners don’t have. As you can see above, they might be right.
ARIMA models are fancy and powerful, but they come with a catch: they require some serious technical know-how. It’s like you’re not just guessing how many cones you’ll sell — you have to dive into the deep end of data, understand autocorrelations, stationarity, and other magical-sounding terms.
If you don’t have a dedicated data analyst on hand to do the heavy lifting, ARIMA might just be a little too much. You’d spend more time wrangling with the data and tuning your model than actually selling ice cream.
ETS (Exponential Smoothing)
ETS (late 1950s) is a group of methods that uses an exponential window function to smooth time series data.
Exponential smoothing and ARIMA models are the two most widely used approaches to time series forecasting, and provide complementary approaches to the problem. While ARIMA models aim to describe the autocorrelations in the data, exponential smoothing models are based on a description of the trend and seasonality in the data.
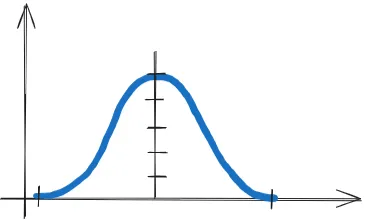
Most popular window functions are similar bell-shaped curves:
The simplest form of exponential smoothing is given below. The idea is that what happened more recently is more important. And you have a factor that decides how much “weight” you give to the past.
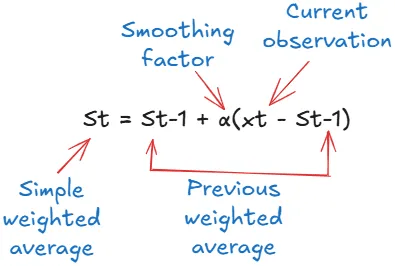
- α close to 1 = less smoothing, more focus on recent data.
- α close to 0 = more smoothing, less focus on the latest changes.
In short: you look at what has already happened, give more importance to the most recent events, and use that to predict what will happen next. And that’s exponential smoothing — basically, giving more attention to the present and less to the distant past.
Holt (1957) and Winters (1960) extended the method to capture trend and seasonality. ETS stands for Error, Trend and Season. Thus, if we combine all three components, we get the original data back. Let’s decompose an example time series below.

The trend indicates the general behavior (tendency) of the time series. It represents the long-term pattern of the data. The season displays the variations related to calendar events. And the error explains what the season and trend don’t. The model works with three key parameters:

The application of every exponential smoothing method requires the smoothing parameters and the initial values to be chosen. The analyst can specify the value of the smoothing parameters based on previous experience, but a more reliable way to obtain values is to estimate them from the observed data. Here are some examples of classic ETS models:

To select which ETS model is best for your time series, you can use statistical criteria. However, this process requires technical expertise from your team, and the ETS model may be difficult to adjust without sufficient knowledge.
Since these models require understanding of statistical analysis, at our ice cream shop they might not be equipped with the technical knowledge needed to adjust and optimize the models effectively.
Choosing the right model: the road to accurate forecasting
So, yes, we have many options. But like any forecasting model, achieving the best performance might take a little tinkering.
Whether you’re channeling the simplicity of Prophet, the power of ARIMA’s historical patterns, or the smoothness of ETS, each model has its strengths — kind of like choosing between a classic car, a sports car, or an electric vehicle.
It depends on your needs and the road ahead! The key is understanding your data, experimenting a bit, and finding which model makes your predictions go from “meh” to “wow!” So, grab your toolkit, get your hands dirty, and let’s drive those forecasts to success 🙂
References
- AWS. Algorithms support for time-series forecasting.
- Facebook Open Source. Prophet.
- TAYLOR, Sean J; LETHAM, Benjamin. Forecasting at scale.
- HYNDMAN, Rob J; ATHANASOPOULOS, George. Forecasting: Principles and Practice.
- IBM. What are ARIMA models?.
